Introduction
What is the difference between Orem, Utah, USA; Munich, Germany; Gold Coast, Queensland, Australia; and St. Petersburg, Russia? Well, they are thousands of kilometers apart, span 3 climate zones from continental to subtropical, and only one of them is home to kangaroos.
What do these places share in common? They are all home to the team behind WebStorm 8.
But there are things more puzzling than that. For example, have you ever suspected it’s possible to trace your code without console.log, debug it without breakpoints, and profile it without JavaScript execution engine specific tools? What if I said you could see what’s happening in your app in real time, as the app executes? And not just your app but any Internet website? And finally, what if you could enjoy all this magic for JavaScript code running in any browser/device?
Today this is all possible. Please welcome spy-js, a new feature of WebStorm 8 that makes all these tricks possible—and much more.
Before going further, I recommend that you watch this 7-minute video, if you haven’t already, to get a general idea of what spy-js is about.
In this post we’ll walk through the tool’s features in more detail, and I’ll share some tips and tricks to improve your experience with spy-js. I’m going to cover a range of topics, including but not limited to:
- Technology Overview
- Spy-js Run Configuration
- Tracing Workflow
- Useful settings and context actions
- Tracing JavaScript on mobile devices
The technology behind spy-js
For better understanding of what spy-js can do and how it can be used, let me start by briefly explaining the technology behind it. When a spy-js run configuration starts, it also starts a spy-js trace server that is implemented using node.js. The trace server acts a proxy server, captures your browser traffic and changes JavaScript files on the fly. The change does not affect the logic of your application; spy-js just inserts additional code instructions to collect runtime information as the code executes and sends the information back to the IDE via the trace server.
Basically, this means that spy-js can trace any JavaScript code that it can proxy. With spy-js, you can trace any Internet website or locally hosted website, as long as it’s not a HTTPS resource. For a locally hosted project, you may use WebStorm’s built-in development HTTP server or any other development server of your choice. Tracing is not limited to desktop browsers installed on your machine: you can as easily trace JavaScript code running on any machine or on any mobile device that is in your local network and configured to use your development machine as a proxy.
Spy-js Run Configuration
As you may have seen in the video I mentioned before, your spy-js experience starts with creating a new Run Configuration. Select Edit configurations from the drop-down menu at the top-right corner of the navigation bar, or from the Run menu.
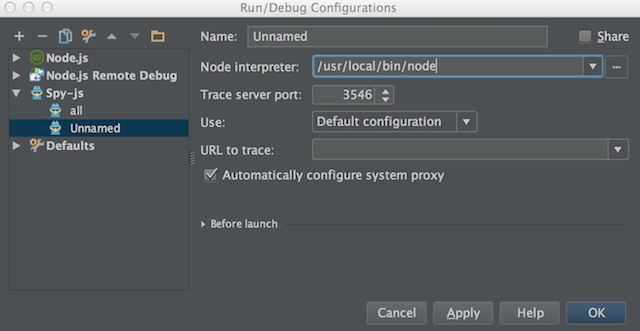
In the configuration you can specify:
- a name for the newly created configuration,
- path to your node.js folder (spy-js uses node.js as a backend for proxy server),
- trace server port (spy-js will start its proxy server on this port),
- whether you’d like to use the default configuration or a custom configuration file, and
- whether you’d like to use an automatic system proxy configuration.
When using the default configuration, you can also specify the URL of the page that you’ll be tracing. The URL is optional; however, if you don’t specify it, your tracing session will capture and display any events from other Internet or local websites (excluding HTTPS resources) that you may be visiting while the session is still running. If you’re working with a locally hosted project and using WebStorm built-in development HTTP server, the URL will be available for you to select in the drop-down list.
The last setting of the spy-js Run Configuration allows you to automatically configure system proxy on your machine whenever you start the spy-js Run Configuration, and revert the system proxy settings when you stop it.
 Quick Tip for Mac OS X: network settings change requires user authorization. When Automatic system proxy configuration is used, the user is prompted to enter his/her password when starting/stopping spy-js Run Configuration, to apply/roll back required settings changes. As suggested in this StackOverflow answer (please also consider security implications described in the answer comments), the following command:
sudo chmod u+s /usr/sbin/networksetup
can be used to disable the mandatory authorization. The setting can be rolled back by running this command:
sudo chmod u-s /usr/sbin/networksetup
Custom Configuration
By default, spy-js will instrument all JavaScript files, prettify minified files, collect runtime information for all events, record function parameters, and return values.
By default, when capturing object runtime values, spy-js does it by traversing no deeper than 1 level into the objects, capturing no more than 3 properties of each traversed level, no more than 3 elements if the object is an array, and no more than 50 characters of each string captured property. It’s worth mentioning that while using the described defaults for object capturing, spy-js has some built-in smarts for some special objects, for example DOM Elements or events like keyboard event or mouse event. It allows you to capture the properties you’d most likely be interested in, like DOM element ID or keyboard event key.
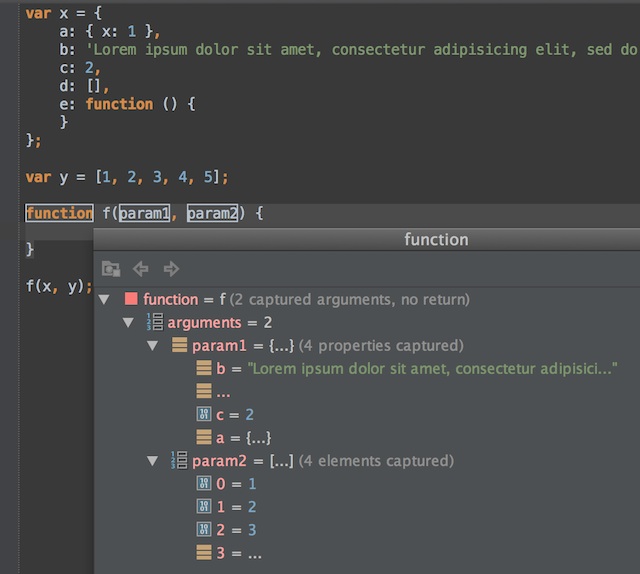
If you’d like to change some of the above mentioned parameters of the default configuration, and to have granular control over capturing settings down to how individual files of your application are traced, you can create and use a custom configuration file.
To use a custom configuration file, create one for your project following the guidelines described in the spy-js documentation. The name of the file should follow the pattern *.conf.js. You can have multiple configuration files for different run configurations, for example: one to trace only some files and capture deep object dump, and another to trace everything without collecting object data at all. Created configuration files can be committed to your VCS and shared across your project team.
Please also note that you can change some of the parameters of the running spy-js session right from the IDE on the fly, like muting certain events and files, without creating a custom configuration file. Later in the post we’ll see how. If, in the future, you would prefer to specify more configuration parameters from the IDE rather than from a configuration file, then upvote this feature request.
Tracing workflow guide and hints
Once the spy-js Run Configuration has been created and started, you can start enjoying the magic. Let’s open some website in a browser and see what happens.
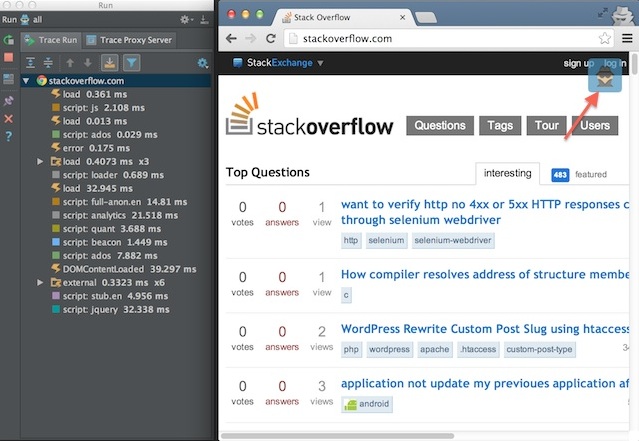
Looking in the top right corner of the traced page, you’ll notice the spy-js icon which indicates that spy-js has successfully started tracing. The icon disappears automatically in a few seconds.
Now let’s have a look into the spy-js tool window and its three panes.
Events
Even as the traced page loads in the browser, in the Events Pane you should be able to observe the page events coming through as they occur on the page. Captured events include not only DOM Events, but essentially any JavaScript code execution roots. It may be some custom event, callbacks invoked as a result of timeout or interval, script loading, or just any externally executed code (for example some code executed from development tools console).
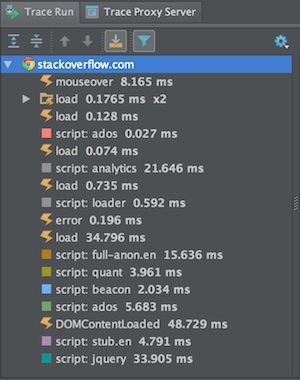
Top-level nodes represent documents of the web pages being traced. Consequent events of the same type are grouped into containers. This prevents wasting vertical space, for example when you have a lot of small mousemove events or timeout callbacks happening one after another. The event container tooltip and title display a number of events within it, and an average execution time across all of the container events. The individual event tooltip also has some useful information, like the list of scripts that participated in the event execution.
Script file names have differently colored icons so you can easily tell them apart when working with the Event Stack pane.
Event Stack
When an individual event is selected, its stack tree is opened in the Event Stack Pane on the right. Stack tree nodes contain short file and function name, as well as the execution time of the function. The tree is searchable by file or function name: you can just start typing while in the tree.

While expanding the stack tree nodes, you may find that some of them have their execution time rendered in blue. It means that the function is responsible for more than 50% of the execution time of the expanded stack level. This feature is very helpful for identifying bottlenecks in your code. Another useful tip is that if an unhandled exception has occurred in one of the functions, its node is displayed in red.
After locating and selecting the function you’re interested in, you can open its trace file with highlighted code execution. As a matter of fact, the file and the highlighted function location inside it are opened automatically on the stack node selection if the Autoscroll to Trace option is set. If the option is not set, you can open the trace file by pressing Enter, double clicking, or selecting Jump to Trace in the context menu of the stack node.
Another useful stack node context menu actions is Jump to Caller. It will open and highlight the statement in code that has invoked the selected function.
Trace File
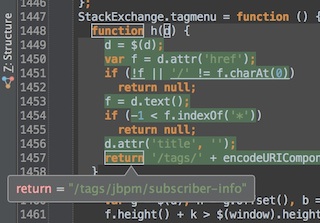
Let’s see what we have in the highlighted trace file. Apart from the highlighted function body, executed statements are highlighted, as well as executed parts of logical expressions and parts of ternary operators. For example, on the screenshot to the right we can see how exactly invoked function "h" was executed. When execution reached the first "if" branch, it evaluated both parts of the logical expression (with || operator) – that is why they are both underlined. Neither of them was true, so the function did not return null. It then did not return null when it reached the second "if" branch; and finally it returned a string.
As you already know, spy-js does not only record the execution path but also captures some objects’ values. Currently these include function arguments, return values, and uncaught exception details. In the above example of the traced function "h", if you hover over its parameter or function keyword or return statement, you’ll see a tooltip with the captured values.
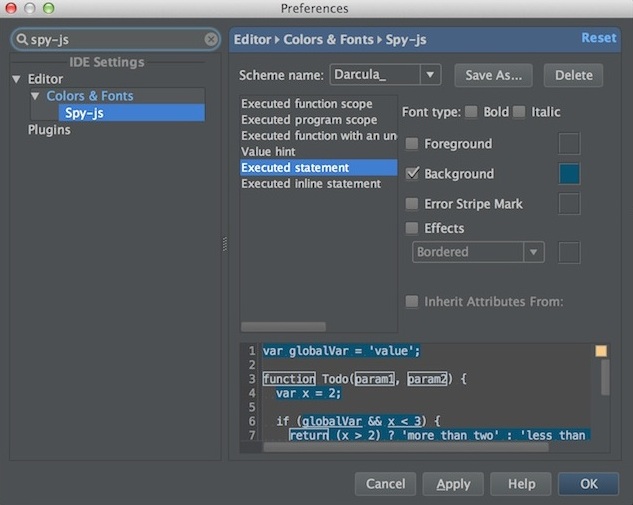
Quick Tip: If you’d like to change the way spy-js highlights executed code, just modify the IDE settings (press double Shift and type “spy-js”). For example, you can make executed statements blue instead of green, or strike out executed logical parts instead of underlining them, or even make the whole thing look like a Christmas tree—just for the fun of it.
Another Quick Tip: Trace files are a read-only representation of the executed code. If you’d like to edit the actual source code (considering it’s a local project script and not just any Internet website), open the context menu of the selected stack node and click Jump to Trace. I’ll also share a sneaky and perhaps more efficient way to jump to the actual source: While keeping the focus in the trace file, just press any key and you’ll jump straight to the source file.
Quick evaluation
 Besides the described tooltip places, captured values can be inspected in the Quick Evaluation Pane (the rightmost one). It can be very handy when you need to quickly see the selected stack node function parameters/return values without opening the trace files. Similar to WebStorm debugger experience, there are context actions to copy/compare/inspect captured values. In addition, the pane tree contains a node with a list of full URLs of the scripts participating in the event execution.
Useful settings and context actions
Tracing Exclusions
Sometimes the number of the captured events can be overwhelming, for example with frequent timeout callbacks or mousemove events. Another annoyance are certain files that you’d rather not see in the stack tree, for example libraries or your application frequently invoked utility scripts that you’re not interested in tracing. To help muting unwanted events/files, spy-js integration provides Capture exclusions.
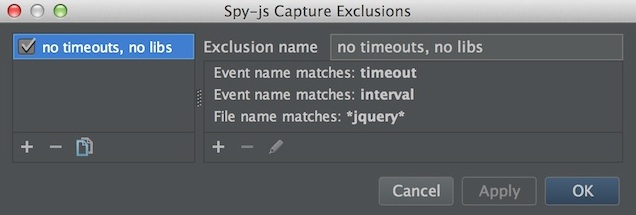
To mute events or files, you can create a new exclusion and apply it by using the corresponding toolbox button. The dialog allows you to create a named exclusion containing one or more conditions. A condition is just an exact name or glob pattern to match the file or event name you’d like to exclude from being captured. So, for example, if you don’t want to trace any mouse events, you can create a condition for an event based on the pattern mouse*. That would filter out mousemove, mouseover, mouseout events. Another example: the file name pattern !{*user.js,*app.js} will make spy-js trace functions only from files whose name ends with user.js or app.js.
Created exclusions can be saved and applied at any time by using the toolbox button with the drop-down list of active exclusions, without having to restart your tracing session.
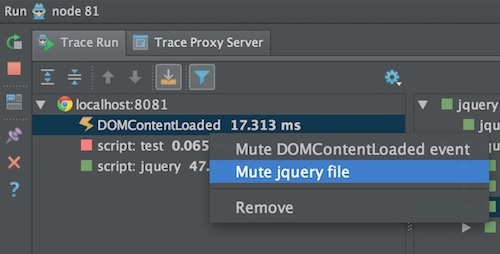
While the Capture exclusions dialog is good to have, sometimes you may see some event or file that you may want to immediately mute. To assist with that, spy-js integration provides a few context actions for the events and event stack pane tree nodes. You can then use the following actions, to quickly add event/file name to the currently active exclusion list or create a new one:
Close trace files, Refresh page, Close page
Other useful context and toolbar actions include an ability to remove events you’re not interested in from the event pane. You can remove some or all events, all events from inactive (for example closed) pages. You can also close opened trace files belonging to a specific page or just all opened trace files.
A couple more page node actions worth mentioning are the self-explanatory Refresh the page in browser and Try closing the page in browser. They let you perform the corresponding operations on a spy-js-traced page without having to switch to the opened browser. These features can save you a lot of time when working with several browsers at the same time and/or refreshing pages frequently.
Mobile device proxy configuration
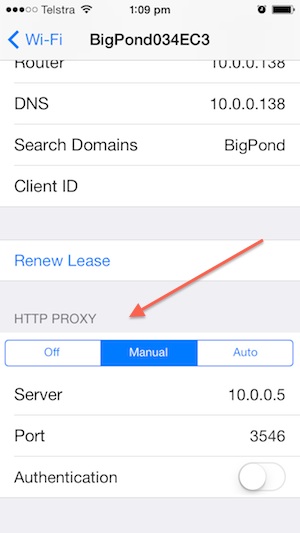
As I said earlier, spy-js can trace your JavaScript wherever it can act as a proxy. To set it up on iOS, go to Settings – Wi-Fi – your Wi-Fi connection, scroll down to HTTP PROXY section and enter your development machine’s IP address and spy-js Run Configuration port (3546 by default). That’s it. Open the device browser, navigate to any page and enjoy the magic… responsibly.
In a similar fashion, you can configure other devices where you’d like to trace your JavaScript code. Please note that if you’re tracing JavaScript code on another device or computer, you may want to clear the Automatically configure system proxy check box since you’ll be specifying the proxy settings manually on the target device. Just to save you some research time, here is how to configure proxy settings manually on Windows, Mac, Ubuntu, iOS, Android, or Windows Phone.
Availability, troubleshooting and feedback
Spy-js is currently bundled in WebStorm 8.0+ and IntelliJ IDEA Ultimate 13.1+. It is available as a free downloadable plugin in PhpStorm 8.0+ EAP, RubyMine Hinoki EAP or newer, and will become available in future versions of PyCharm Professional.
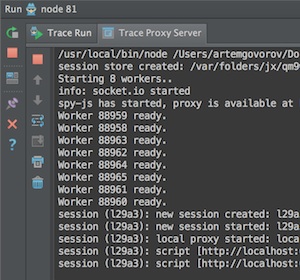
If something bad or unexpected happens during a spy-js tracing session, it’s your website’s fault check for log messages on the Trace proxy server tab. It may give you an indication of what exactly is going on, how to fix it, or what to attach to the issue report if it comes to that.
There are some known and described limitations you may run into while tracing. For one, spy-js can not yet trace HTTPS traffic pages and inline JavaScript code (one in <script>...</script> tags).
Keep in mind that you’re often just a few keystrokes away from something that can still be fixed or improved. So, please report your findings/suggestions to our YouTrack and we will have a win-win situation for everyone.
Spy with pleasure
If you’re still reading this, let me thank you for your patience and congratulate you, because by now you’re really close to being an expert on spy-js. To complete the quest, there are just two things left. First, go ahead and download WebStorm 8, start spy-js, open your favorite website in your favorite browser and see what’s going on in its code. And second, follow spy-js on Twitter if you like spy-js (and if you don’t like it, follow and tell me why!).