Profiling is hard work. The amount of gathered information and demand to keep in mind the execution times and code structure is a serious challenge.
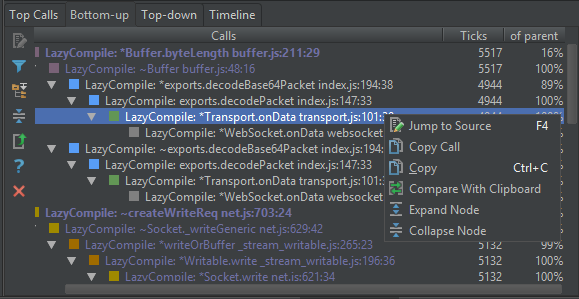
WebStorm assists you on this tough journey. It points at hot spots by opening and highlighting them in call trees. It will immediately navigate you to the related source code. The IDE can filter out “noise” by showing only functions that took lots of time. And, by the way, it will also start a Node.js application with profiling and automatically open the profile after the run.
If you’d like to immediately try the feature, start with checking Record CPU profiling info in the V8 Profiling tab in your Node.js Run Configuration.
Table of content
Background information
CPU profiling is a way to look inside the code execution and see how the system lives in dynamics. Due to the Node.js IO-bound one-thread architecture, it is especially dangerous to experience a CPU-consuming callback in the event thread.
Profiling method and results distortion. As you may know, V8 is an open-source JavaScript engine developed by Google. It’s used in Google Chrome, Chromium, Node.js, and io.js.
V8 has a built-in sampling CPU profiler, which provides information about the execution of your code and the behavior of the JavaScript engine itself: garbage collection cycles, compilation and re-compilation, and code optimization. Node.js CPU profiling in WebStorm is built around the V8 profiler.
What is really important is that you need to consider the method of gathering profiling information. Sampling profilers periodically record stack traces of your application. This method does not guarantee very good accuracy: snapshots happen to be taken at random moments, the term “random” in this context meaning “independent from the application execution.”
The recorded information does not provide us with the whole picture of what happened during execution, it does not contain all called functions, and it can even distort the relative quantities of function calls. Sampling profilers can not say how many times a function was called. However, statistically this method gives results that are good enough to judge about hot spots.
Remote profiling. It is technically possible to run Node.js applications with profiling on remote machines, and work with resulting log files. This can be useful for stress testing of your application.
To do it, start your Node.js application with the following flags:
node.js --prof --log-timer-events
After the execution, open the v8.log file in WebStorm by choosing Tools | V8 Profiling | Analyze V8 Profiling Log on the main menu.
You can find more information on running the internal profiler from the command line in the V8 wiki or in this article from Chromium “For Developers” section.
It all may sound too complicated, but don’t panic! WebStorm tries to simplify the inner details for the developer: you just run the application and see the hot spots.
Here you are:
Diving into the feature details
To put in two words, use can use CPU profiling with the following scenarios:
- Run a Node.js application from WebStorm with CPU profiling.
After application execution is over, the CPU profile view is opened. - Open a previously recorded Node.js profiling log.
When using scenario 1, one or several log files are created by the V8 engine. You can always open them again later.
Also, you can record V8 profiling log on another environment (see section about Remote Profiling). - Open a log file recorded by Chrome or Chromium (run with profiling flags).
To open a log file, choose Tools | V8 Profiling | Analyze V8 Profiling Log on the main menu. The parameters in the dialog are the same as in the Run Configuration described below.
Running Node.js application under profiler
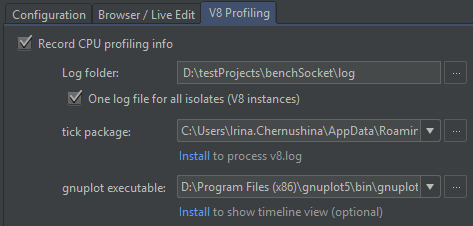
Set your Node.js Run Configuration to record V8 profiling information:
Specify the path to the tick Node.js package — we use it to transform recorded logs into statistical CPU profiles. Tick contains V8 scripts, adopted for use with Node.js.
Gnuplot is used for timeline creation. You may omit this parameter, but then no timeline will be created. You can find more details on the installation below.
Click Run to start your application, and run the scenario that you would like to investigate.
After the application execution is finished, the CPU profile will be opened in the V8 Profiling tool window.
Explore call trees
We present the collected information in the following ways:
- Top Calls: hot spots list (a list of actions that took long)
- Bottom-up: first, we show hot spots together with their callers, and callers of their callers etc., i.e. a tree of callers.
- Top-down: from entry points we unroll the execution tree down, from caller functions to callees.
The sampling profiler takes stack traces at certain interval — called tick. Therefore time in a CPU profile is presented in tick units.
The number of ticks or its ratio to the total execution time is presented as Total or Self. The Total value shows how much time was spent inside the function and the functions it called (i.e. recursively). The Self value shows how much time was spent only inside the function itself, not taking into account its child nodes.
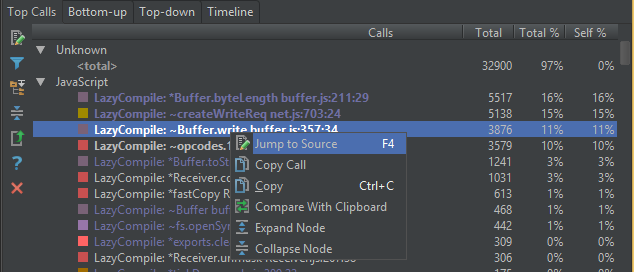
Top Calls view
Here you can notice the following details:
We use text color codes to distinguish between native (JavaScript engine) actions — shown in grey, Node.js calls — shown in blue, and the user code — just of the default text color.
We use icon color codes to differentiate files: functions from the same file are shown with the same color.
You can navigate to code! We will search for files and symbols mentioned in snapshot and will try to find them in your project. We also can go inside Node.js sources and core modules and inside V8 sources (for that, just download Node.js core modules in Settings | Languages & Frameworks | Node.js and npm).
Bottom-up view
Here for every method we show which ratio of its caller, i.e. its parent time it took. In the screenshot you can see how to filter the results: you can choose to see only the functions that took more than 5% of the total execution time.
Top-down view
Here you literally get full control over the execution information.
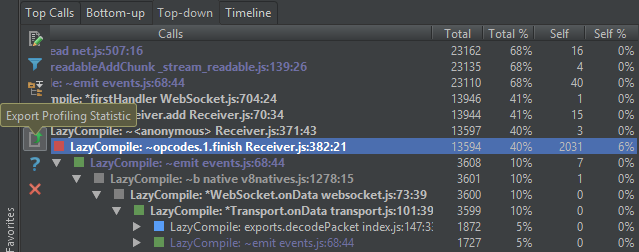
You can see all calls as a tree. Sometimes the tree can go really deep. To help you deal with it, we show you the call tree already expanded, expanding all nodes where execution took longer than 10% (for either the Self or the Total time).
Also, on the screenshot you can see the tooltip of the Export action: you can get all these trees—Top Calls, Bottom-up, Top-down—saved as a text file!
V8 optimizer
Note the signs ~ and * before function names:
* means that the function was optimized by V8.
~ means that the function was not optimized.
Though optimization may be delayed by the engine (and is not performed for short-running code), this might point at places where the code can be rewritten for better performance. More information on the subject is available in this article.
Timeline: see the dynamics!
To work with the Timeline view, make sure you’ve specified the path to gnuplot in the Run configuration.
The Timeline view helps to find application pauses and explore the calls that provoked them. You also see garbage collection and user code execution together, in one picture.
We took the chart that V8 creates for us (for plot interpretation, please refer to the Google Chromium documentation), and added several actions to zoom into time interval or get stack traces around longest pauses.
Here is how to zoom:
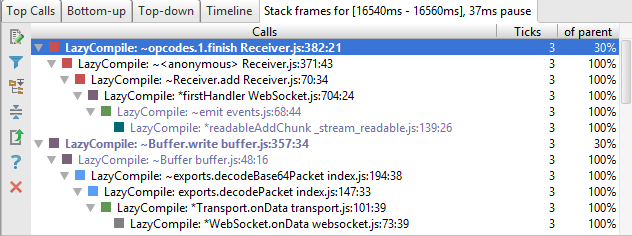
To see the stack frames for the longest pause, click Show in the popup appearing above the blue arrow at the bottom of the timeline:
and get the stack traces:
Installation and configuration information
Run Configuration/Analyze V8 Profiling Log parameters:
Log folder — the folder where v8.log files will be written.
One log file for all isolates (V8 instances) — whether to create only one log file (and (accordingly) one profiling results view) for all V8 instances or have a separate file for each instance (additional V8 instance can be created by Node.js, for example, for a debug process).
tick package — path to the tick package. This package contains V8 scripts for transformation of recorded logs into CPU profiles, adopted for use with Node.js.
Run npm install -g tick to install the tick package.
gnuplot executable — path to the gnuplot executable. Gnuplot is a well known graphing utility. It is used by V8 scripts to create timeline images.
Gnuplot installation
Windows
To install gnuplot on Windows download the installer using the appropriate link provided on the gnuplot website and then run the installation.
Linux
We recommend using APT to install gnuplot and all the required dependency on Ubuntu.
Run sudo apt-get install gnuplot-x11 in the command line.
On other Linux systems, we suggest using your package manager or downloading a .tar.gz file from gnuplot website and then following the steps in the readme file. Make sure that you also have the x11 and libgd libraries installed.
Mac OS X
On Mac OS, you can use the Homebrew package manager:
brew install gnuplot --with-aquaterm --with-x11
If you see an error message about missing png or pngcairo terminals, please check whether they’re installed with the gnuplot -e set terminal command. If the libraries are missing, we recommend reinstalling gnuplot using a package manager (APT, Brew, Port, etc).
