WebStorm comes with many powerful tools to assure the high quality of your code base.
Dozens of built-in inspections are enabled by default. These static code analysis tools help you find probable bugs, detect performance issues and improve the overall code structure right as you write the code. You can also use the integrated code quality tools: JSHint or JSLint.
Inspections are available for all languages supported by WebStorm, including JavaScript, Node.js, HTML, CSS, Less, Sass, TypeScript, CoffeeScript and Dart.
Built-in inspections help you detect errors and potential problems, from obvious ones like a missing semicolon to more complex issues like unresolved methods in JavaScript and mismatching types when type info is available.
On-the-fly code analysis
Here are several examples of inspections in JavaScript:
And in Less:
The description of the error shows up when you hover the mouse over the highlighted code.
Quick-fixes
Most inspections provide quick-fixes to deal with the issue right away:
Position the caret on the highlighted code and press Alt-Enter to see the list of available quick-fixes or intentions. Choose the action you need with the arrow keys and press Enter:
You can enable and disable intention suggestions in Preferences | Intentions.
Suppressing inspection
If you don’t want an inspection to be performed for a specific statement or method, you can suppress it from the list of intention actions (Alt+Enter) by pressing the right arrow. Alternatively, you can disable this inspection for the whole project:
Navigation to errors in files
All the warnings and errors in the current file are color-marked on the scroll bar.
The Lens mode allows you to preview the highlighted line of code and inspection description, without actually navigating to that line:
Keyboard shortcuts are also available for navigation to the next highlighted error in the current file (F2) or the previous one (Shift+F2).
Managing inspections
Inspection profile
The full list of built-in inspections is available in Preferences | Inspections:
Here you can set up your Global or Project specific inspection profile.
If you select Share profile, then the list of enabled inspections will be saved in the project’s .idea folder that you can put into your VCS and share with your team.
Using JSHint and JSLint
You can also use JSHint and JSLint as your code quality tools.
To enable JSHint or JSLint, go to Preferences | JavaScript | Code quality tools, select Enable, and then configure the tool-specific inspections:
For JSHint, you can also use your configuration files: your project’s .jshintrc file, package.json with JSHint options, or a config file located elsewhere:
Configuration of highlighting levels
As you may have noticed, some inspections highlight the code in yellow, while others just underline it. This depends on the level of Severity selected for each inspection.
You can adjust these levels in Preferences | Inspections per individual inspection:
Code analysis
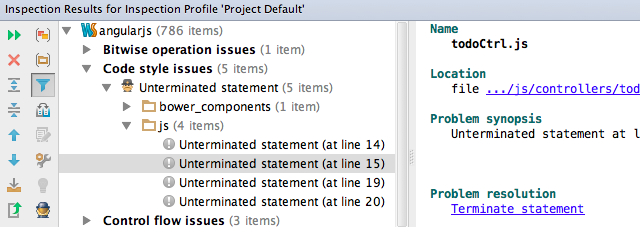
You can perform code analysis for the whole project, selected directory, uncommitted files or a custom scope with the Inspect code command in the main Code menu.
From the code analysis report, you can easily navigate to the line with the error or warning:
Give these tools a try if you haven’t already, to help yourself write and maintain high-quality code.
Develop with pleasure!
JetBrains WebStorm Team


